library(tidyverse)
library(broom)
library(interactions)
library(mediation)

employees <- read_csv(
  "data/employee_survey.csv",
  show_col_types = FALSE
) |>
  mutate(
    leadership_4 = 6 - leadership_4_reverse,
    engagement_4 = 6 - engagement_4_reverse,
    leadership = rowMeans(
      across(c(leadership_1, leadership_2, leadership_3, leadership_4)),
      na.rm = TRUE
    ),
    engagement = rowMeans(
      across(c(engagement_1, engagement_2, engagement_3, engagement_4)),
      na.rm = TRUE
    ),
    workload_c = workload - mean(workload, na.rm = TRUE),
    support_c = organizational_support -
      mean(organizational_support, na.rm = TRUE)
)7. Moderation and mediation
Learning goals
You will learn to:
- distinguish moderation from mediation;
- create scale scores before modelling;
- estimate and visualize an interaction;
- estimate a simple statistical mediation model;
- explain why neither analysis automatically establishes causality.
Two different questions
Moderation asks when or for whom a relationship changes.
Is the association between workload and burnout weaker when organizational support is high?
Mediation asks through what statistical pathway variables are related.
Is leadership associated with performance partly through employee engagement?
These questions require different models.
Prepare the constructs
Centering makes zero represent the sample mean. It can make the lower-order coefficients easier to interpret, but it does not change the interaction test.
Moderation: estimate an interaction
# A tibble: 6 × 7
  term                 estimate std.error statistic   p.value conf.low conf.high
  <chr>                   <dbl>     <dbl>     <dbl>     <dbl>    <dbl>     <dbl>
1 (Intercept)           42.0       1.34       31.4  4.77e-118 39.4        44.6
2 workload_c             6.11      0.279      21.9  5.32e- 74  5.57        6.66
3 support_c             -3.37      0.301     -11.2  4.92e- 26 -3.97       -2.78
4 age                    0.0475    0.0321      1.48 1.39e-  1 -0.0155      0.111
5 tenure_years           0.155     0.0818      1.90 5.83e-  2 -0.00545     0.316
6 workload_c:support_c  -2.12      0.303      -6.98 9.71e- 12 -2.71       -1.52
The workload_c:support_c term is the interaction. It tests whether the slope of workload differs across levels of organizational support.
Visualize the interaction
interact_plot(
  moderation_model,
  pred = workload_c,
  modx = support_c,
  plot.points = TRUE,
  interval = TRUE
)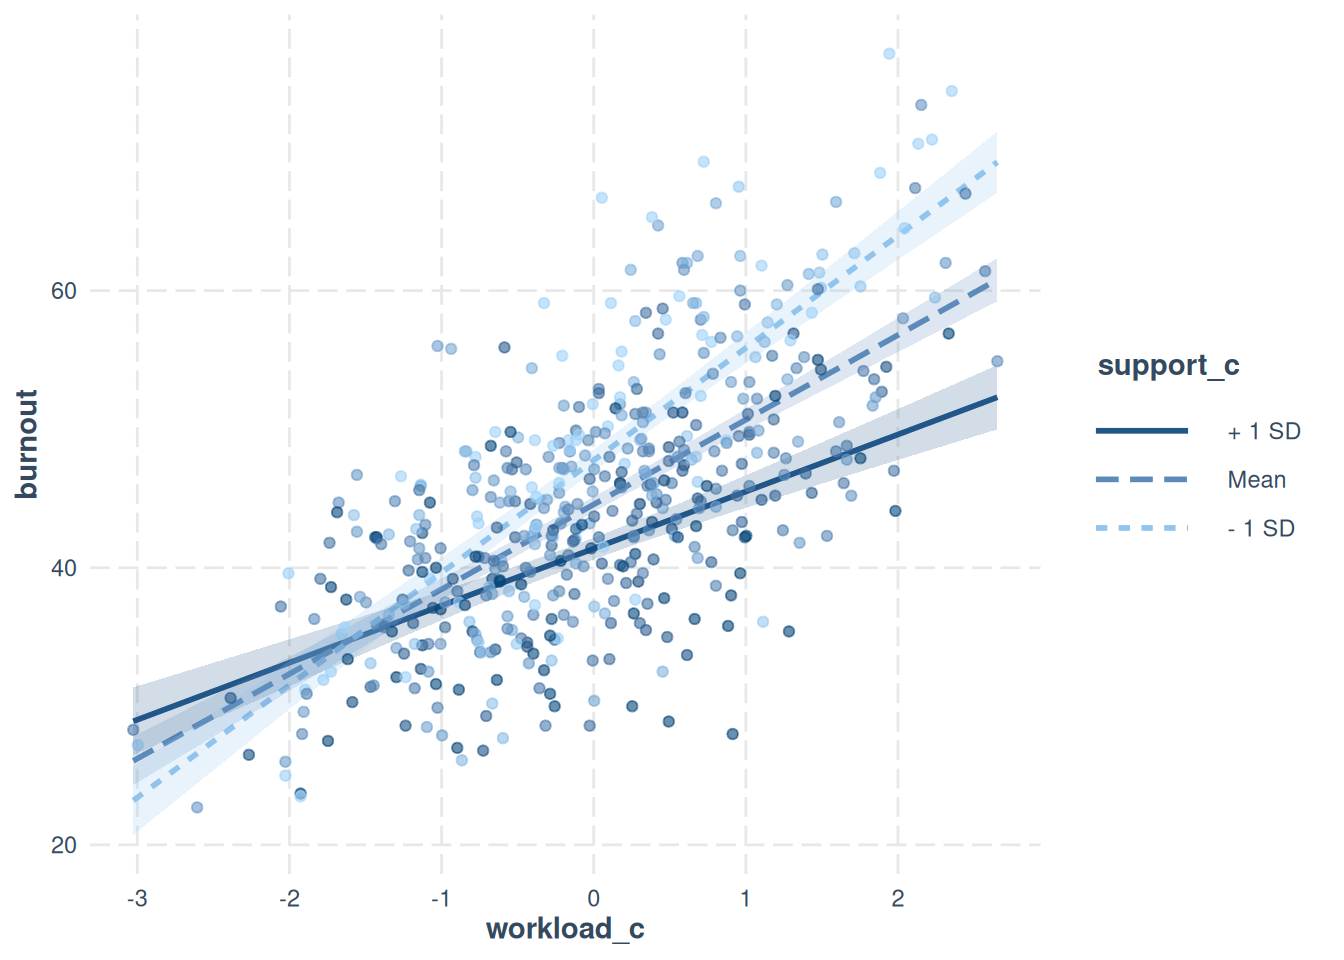
Interpret the pattern before focusing on significance:
- What happens to predicted burnout as workload rises?
- Is that increase different at lower and higher support?
- Are observations available across the plotted combinations?
When an interaction is included, the coefficient for workload is its estimated slope when centered support equals zero—that is, at average support.
Mediation: estimate two regressions
First, create one complete-case dataset containing every variable used by both models. This ensures that the mediator and outcome models use exactly the same observations.
[1] 472The mediator model predicts engagement:
mediator_model <- lm(
  engagement ~ leadership + age + tenure_years,
  data = mediation_data
)
The outcome model predicts performance:
outcome_model <- lm(
  performance ~ leadership + engagement + age + tenure_years,
  data = mediation_data
)
Estimate the indirect effect:
Causal Mediation Analysis

Nonparametric Bootstrap Confidence Intervals with the Percentile Method

               Estimate 95% CI Lower 95% CI Upper p-value
ACME            2.79067      2.30918      3.35750  <2e-16 ***
ADE             0.34629     -0.26286      0.93730   0.296
Total Effect    3.13696      2.49109      3.74764  <2e-16 ***
Prop. Mediated  0.88961      0.72550      1.10005  <2e-16 ***
---
Signif. codes:  0 '***' 0.001 '**' 0.01 '*' 0.05 '.' 0.1 ' ' 1

Sample Size Used: 472


Simulations: 500 plot(mediation_result)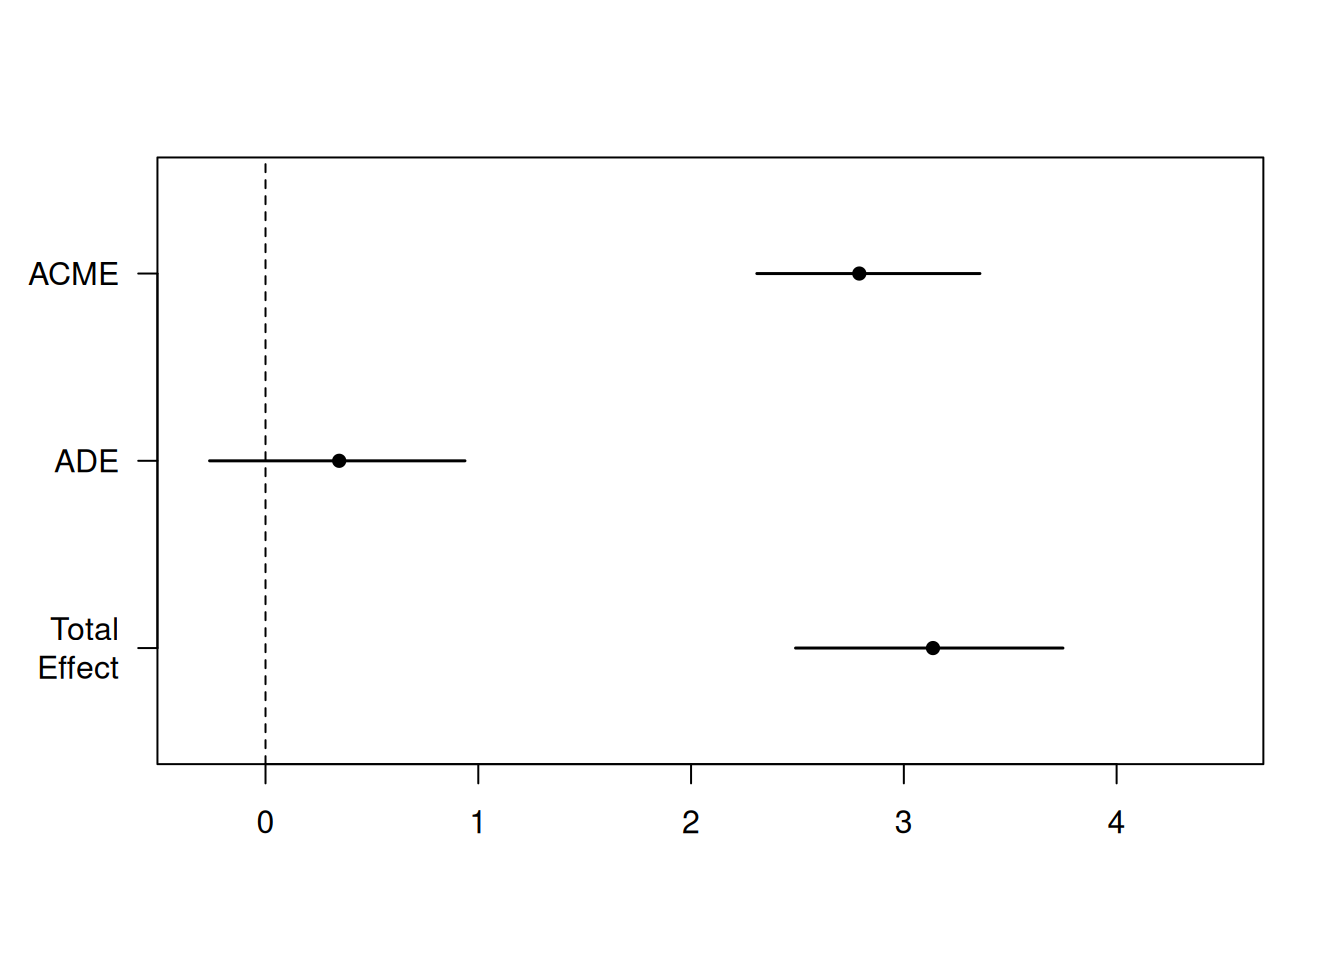
Key quantities include:
- average causal mediation effect reported by the software;
- average direct effect;
- total effect;
- proportion mediated.
The package uses causal terminology, but a cross-sectional observational dataset does not, by itself, justify a causal mediation claim. In this lesson, describe the result as a statistical indirect association.
Practice
- Remove the interaction and compare the model.
- Plot the moderation without raw points. Which view is more informative?
- Reverse the mediator and outcome conceptually. Why is theory essential?
- Write separate one-paragraph interpretations for moderation and mediation.
Common mistakes
- Treating moderation and mediation as interchangeable.
- Interpreting lower-order terms without considering the interaction.
- Claiming a mechanism from cross-sectional correlations alone.
- Selecting a mediator only because the indirect effect is significant.
- Ignoring measurement quality of the constructs.
Takeaway
Moderation describes changing relationships; mediation describes an indirect pathway. Both depend on theory, measurement, design, and cautious interpretation.