[1] 24[1] 480 26glimpse(employees)Rows: 480
Columns: 26
$ employee_id <chr> "E000001", "E000002", "E000003", "E000004", "E0…
$ age <dbl> 37, 32, 22, 44, 42, 41, 48, 23, 32, 25, 51, 39,…
$ gender <chr> "Man", "Man", "Man", "Woman", "Woman", "Woman",…
$ department <chr> "Operations", "Operations", "Operations", "Tech…
$ remote_days <dbl> 3, 3, 1, 1, 3, 0, 3, 0, 3, 4, 2, 0, 4, 1, 2, 2,…
$ tenure_years <dbl> 9.2, 7.0, 0.7, 4.2, 7.4, 1.6, 1.6, 2.9, 10.0, 6…
$ manager <chr> "No", "No", "No", "No", "No", "Yes", "No", "Yes…
$ training_group <chr> "Training", "Training", "Control", "Training", …
$ leadership_1 <dbl> 1, 3, 5, 3, 3, 2, 3, 3, 5, 2, 4, 5, 1, 2, 1, 2,…
$ leadership_2 <dbl> 1, 1, 5, 2, 4, 3, 3, 4, 5, 1, 5, 5, 1, 1, 1, 2,…
$ leadership_3 <dbl> 1, 1, 5, 3, 5, 4, 4, 2, 5, 2, 5, 5, 1, 1, 2, 2,…
$ leadership_4_reverse <dbl> 5, 5, 1, 4, 1, 3, 3, 4, 1, 5, 2, 1, 3, 4, 4, 3,…
$ engagement_1 <dbl> 2, 3, 5, 4, 5, 3, 5, 2, 5, 3, 4, 5, 3, 2, 4, 5,…
$ engagement_2 <dbl> 2, 1, 3, 5, 4, 4, 5, 1, 5, 2, 4, 5, 4, 2, 3, 1,…
$ engagement_3 <dbl> 1, 1, 4, 4, 4, 4, 5, 2, 5, 2, 5, 5, 4, 1, 3, 3,…
$ engagement_4_reverse <dbl> 3, 4, 1, 2, 2, 4, 1, 3, 1, 5, 1, 1, 3, 5, 2, 2,…
$ role_clarity_1 <dbl> 1, 1, 4, 4, 5, 4, 3, 2, 3, 3, 5, 3, 2, 1, 1, 2,…
$ role_clarity_2 <dbl> 1, 3, 3, 5, 4, 4, 5, 3, 4, 2, 5, 5, 1, 1, 1, 1,…
$ role_clarity_3 <dbl> 1, 2, 3, 4, 4, 3, 4, 3, 5, 4, 5, 2, 2, 1, 1, 2,…
$ role_clarity_4 <dbl> 1, 4, 3, 3, 3, 2, 5, 5, 5, 3, 4, 4, 2, 1, 1, 3,…
$ workload <dbl> 3.44, 4.68, 4.68, 4.09, 4.26, 2.25, 2.79, 4.16,…
$ organizational_support <dbl> 2.50, 3.92, 5.09, 3.72, 3.63, 3.97, 5.58, 4.25,…
$ job_satisfaction <dbl> 2.52, 4.17, NA, 4.87, 3.17, 5.68, 4.86, 3.77, 5…
$ performance <dbl> 45.1, 43.8, 52.2, 60.3, 59.9, NA, 64.3, 48.1, 6…
$ burnout <dbl> 49.8, 48.5, 47.4, 47.1, 51.8, 36.3, 32.1, 46.6,…
$ turnover_intention <dbl> 4.84, 4.18, 3.66, 4.12, 4.62, 2.83, 3.16, 5.26,…employees |>
count(department, sort = TRUE)# A tibble: 5 × 2
department n
<chr> <int>
1 Operations 125
2 Technology 104
3 Marketing 100
4 Finance 97
5 HR 54# A tibble: 1 × 4
age tenure_years workload performance
<dbl> <dbl> <dbl> <dbl>
1 38.2 4.79 4.09 53.9employees |>
summarise(across(everything(), ~ sum(is.na(.x)))) |>
pivot_longer(everything(), names_to = "variable", values_to = "missing")# A tibble: 26 × 2
variable missing
<chr> <int>
1 employee_id 0
2 age 0
3 gender 0
4 department 0
5 remote_days 0
6 tenure_years 0
7 manager 0
8 training_group 0
9 leadership_1 0
10 leadership_2 8
# ℹ 16 more rowsemployees_clean <- employees |>
mutate(
remote_mode = case_when(
remote_days == 0 ~ "On-site",
remote_days <= 3 ~ "Hybrid",
TRUE ~ "Mostly remote"
)
)
employees_clean |>
group_by(training_group) |>
summarise(
n = sum(!is.na(performance)),
mean_performance = mean(performance, na.rm = TRUE),
sd_performance = sd(performance, na.rm = TRUE)
)# A tibble: 2 × 4
training_group n mean_performance sd_performance
<chr> <int> <dbl> <dbl>
1 Control 217 52.0 8.78
2 Training 255 55.6 9.18employees_clean |>
ggplot(aes(x = performance)) +
geom_histogram(bins = 25)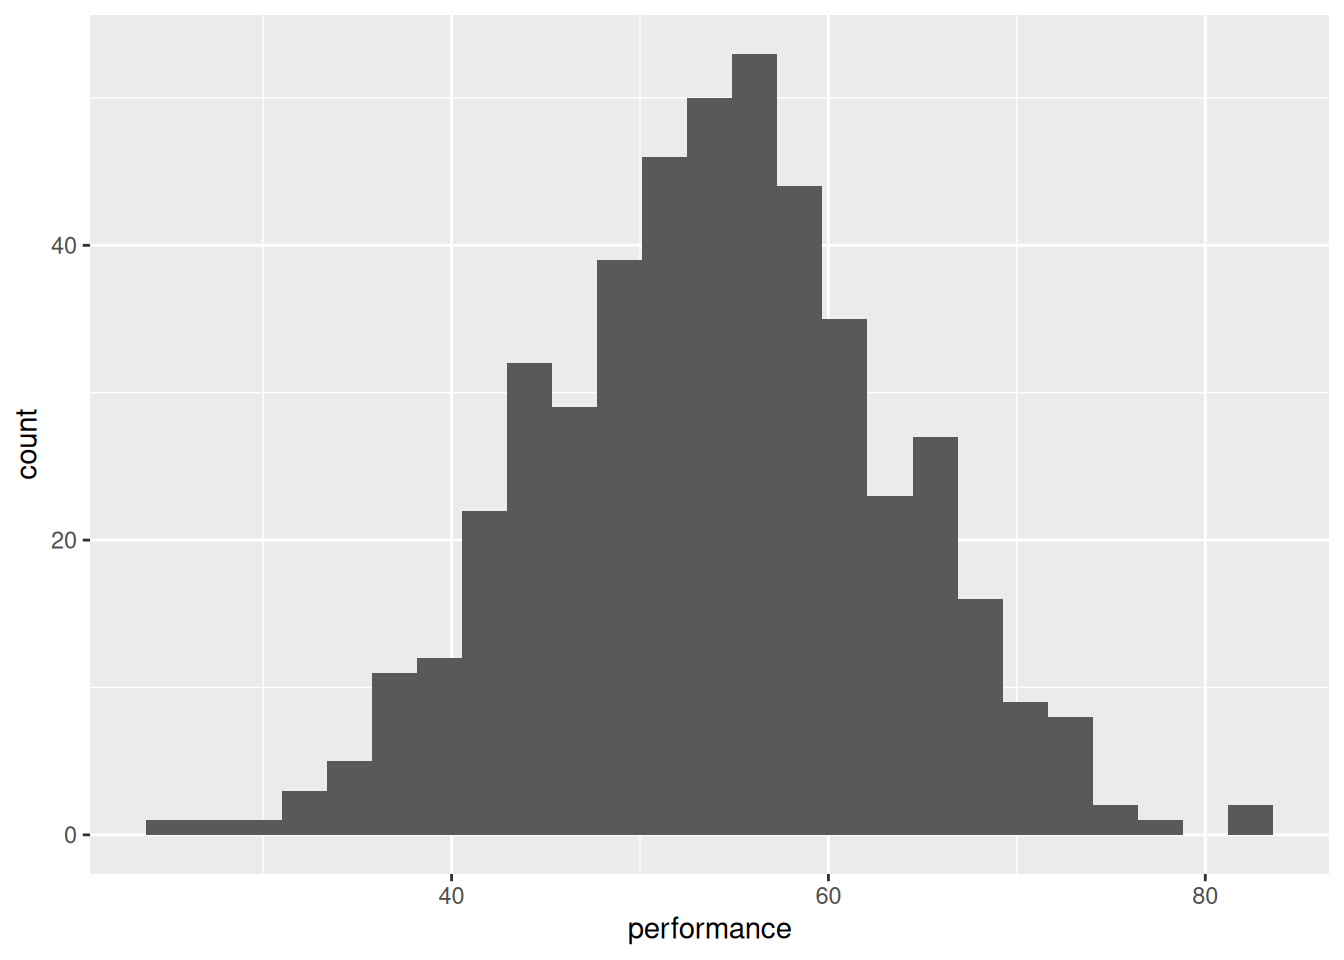
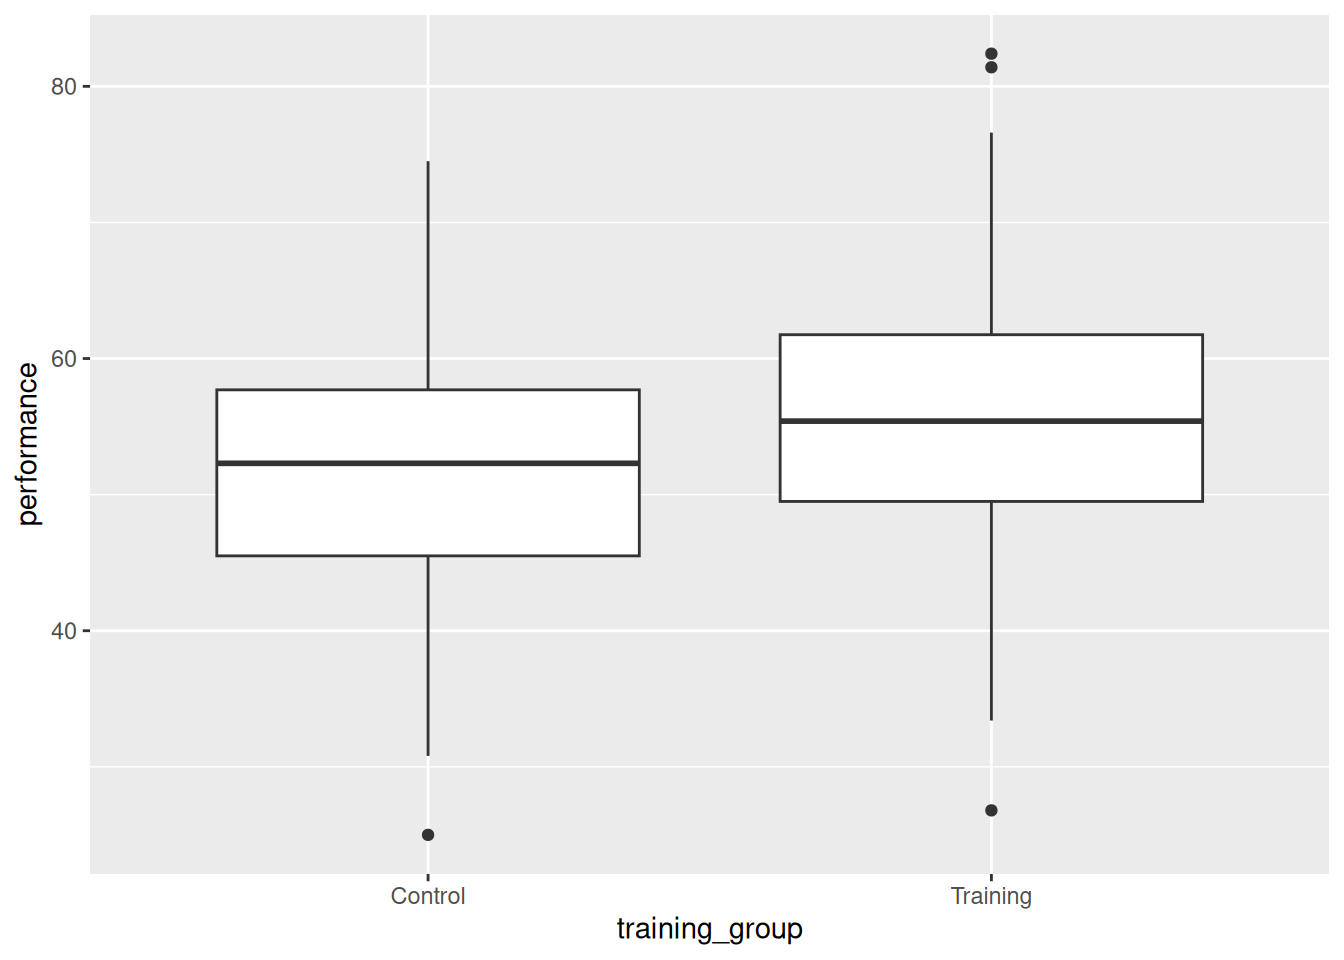
employees_clean |>
  ggplot(aes(x = training_group, y = performance)) +
  geom_boxplot()